Five centuries of trade: from 2% of GDP to 57%, with one great reversal
Original title: Trade openness over time · Our World in Data · 27 Jul 2026
Original chart: Our World in Data
So what
Globalisation has been reversed before: trade fell from about 30% of world GDP in 1913 to around 10% by 1945. Today's level is roughly double the pre-1914 peak and has plateaued since 2008, not collapsed. The interwar episode is the reference case for boards weighing tariff wars and bloc formation.
- Data sources
- Klasing and Milionis (2014); Estevadeordal, Frantz and Taylor (2003); World Bank (WDI); Penn World Table 11.0
- Authors
- Our World in Data
- Source article
- Not recorded
- Rights
- Third-party rights need checking. The chart is not reproduced here.
- Publisher terms
- Read Our World in Data’s terms ↗
Related perspectives

The rich-poor income gap widened from 2x in 1820 to 16x today
MacroeconomyNot function-specificNorth America
Data
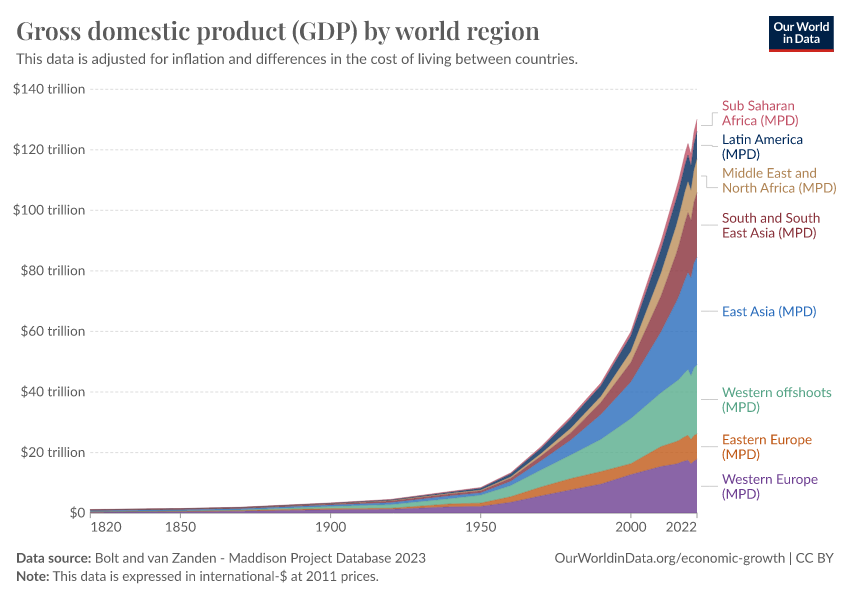
Asia is back to 44% of world GDP, from 28% in 1990
MacroeconomyNot function-specificGreater China
Data
South Korea's dependency ratio will more than double by 2050
MacroeconomyTalent & workforceJapan & Korea
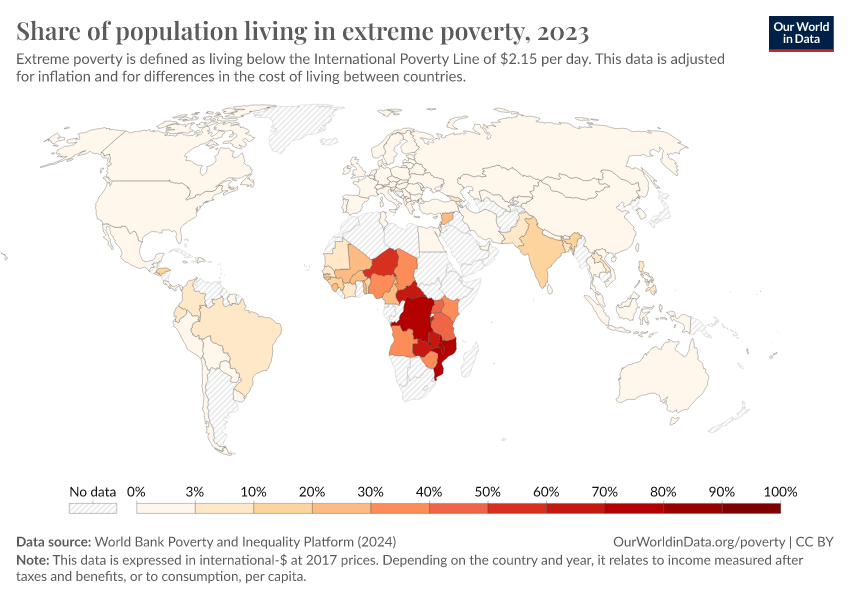
Indonesia cut extreme poverty from 86% to 4%, nearly matching China
MacroeconomyNot function-specificGreater China
Data