The rich-poor income gap widened from 2x in 1820 to 16x today
Original title: GDP per capita · Our World in Data · Date unavailable

Chart: Our World in Data, CC BY 4.0
So what
In 1820 the richest region (the US and other Western offshoots) was about twice as rich per head as Sub-Saharan Africa; by 2022 the gap was over 16 times. East Asia shows the way out: from $1,100 per head in 1950 to $22,000, a twentyfold rise. Convergence is possible, but it has been regional, not universal.
| Label | Value | Unit | Period |
|---|---|---|---|
| Western offshoots (US, Canada, Australia, NZ) GDP per capita | 2513.0454 | international-$ (2011 prices) | 1820 |
| Western offshoots (US, Canada, Australia, NZ) GDP per capita | 14773.206 | international-$ (2011 prices) | 1950 |
| Western offshoots (US, Canada, Australia, NZ) GDP per capita | 35619.383 | international-$ (2011 prices) | 1990 |
| Western offshoots (US, Canada, Australia, NZ) GDP per capita | 56567.887 | international-$ (2011 prices) | 2022 |
| Western Europe GDP per capita | 2170.7048 | international-$ (2011 prices) | 1820 |
| Western Europe GDP per capita | 7239.914 | international-$ (2011 prices) | 1950 |
| Western Europe GDP per capita | 25367.219 | international-$ (2011 prices) | 1990 |
| Western Europe GDP per capita | 41323.023 | international-$ (2011 prices) | 2022 |
| East Asia GDP per capita | 911.1599 | international-$ (2011 prices) | 1820 |
| East Asia GDP per capita | 1109.4408 | international-$ (2011 prices) | 1950 |
| East Asia GDP per capita | 6089.8413 | international-$ (2011 prices) | 1990 |
| East Asia GDP per capita | 21728.52 | international-$ (2011 prices) | 2022 |
| Eastern Europe GDP per capita | 1044.5385 | international-$ (2011 prices) | 1820 |
| Eastern Europe GDP per capita | 4133.084 | international-$ (2011 prices) | 1950 |
| Eastern Europe GDP per capita | 10091.273 | international-$ (2011 prices) | 1990 |
| Eastern Europe GDP per capita | 20656.266 | international-$ (2011 prices) | 2022 |
| Middle East and North Africa GDP per capita | 885.8996 | international-$ (2011 prices) | 1820 |
| Middle East and North Africa GDP per capita | 2287.5552 | international-$ (2011 prices) | 1950 |
| Middle East and North Africa GDP per capita | 6431.515 | international-$ (2011 prices) | 1990 |
| Middle East and North Africa GDP per capita | 19874.799 | international-$ (2011 prices) | 2022 |
| World GDP per capita | 1127.73 | international-$ (2011 prices) | 1820 |
| World GDP per capita | 3360.164 | international-$ (2011 prices) | 1950 |
| World GDP per capita | 8210.969 | international-$ (2011 prices) | 1990 |
| World GDP per capita | 16676.75 | international-$ (2011 prices) | 2022 |
| Latin America GDP per capita | 956.9071 | international-$ (2011 prices) | 1820 |
| Latin America GDP per capita | 3678.346 | international-$ (2011 prices) | 1950 |
| Latin America GDP per capita | 8054.83 | international-$ (2011 prices) | 1990 |
| Latin America GDP per capita | 14028.038 | international-$ (2011 prices) | 2022 |
| South and South East Asia GDP per capita | 919.20123 | international-$ (2011 prices) | 1820 |
| South and South East Asia GDP per capita | 1069.7146 | international-$ (2011 prices) | 1950 |
| South and South East Asia GDP per capita | 2573.6833 | international-$ (2011 prices) | 1990 |
| South and South East Asia GDP per capita | 8377.074 | international-$ (2011 prices) | 2022 |
| Sub Saharan Africa GDP per capita | 1188 | international-$ (2011 prices) | 1820 |
| Sub Saharan Africa GDP per capita | 1326.6232 | international-$ (2011 prices) | 1950 |
| Sub Saharan Africa GDP per capita | 1812.6813 | international-$ (2011 prices) | 1990 |
| Sub Saharan Africa GDP per capita | 3436.5957 | international-$ (2011 prices) | 2022 |
Related perspectives
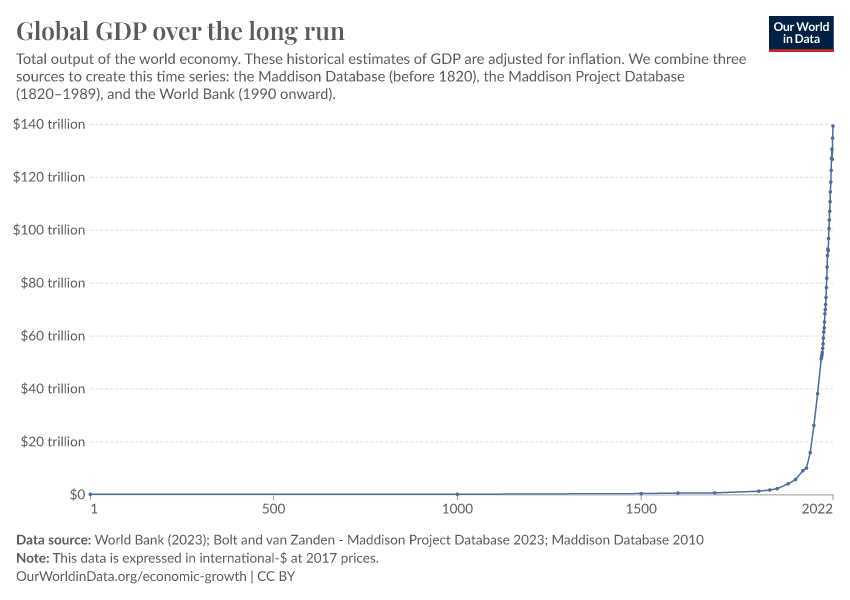
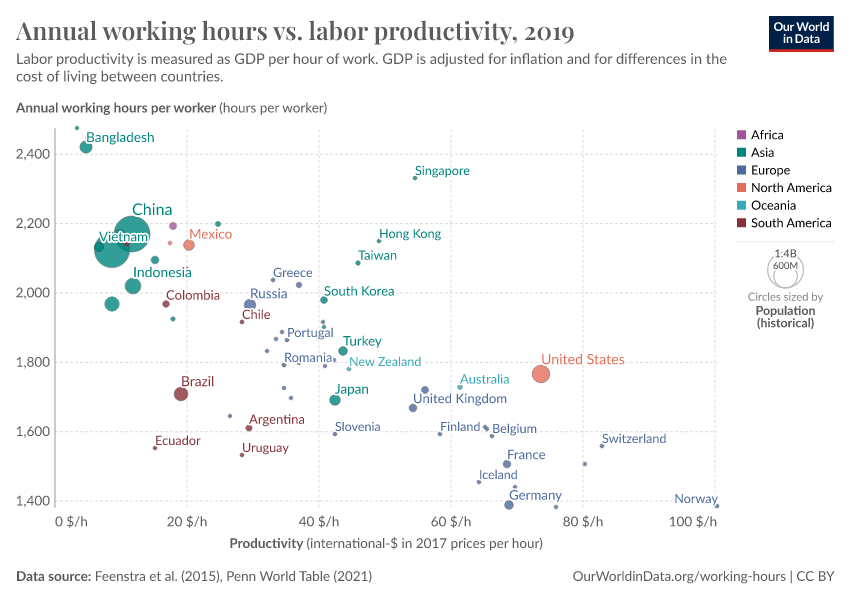
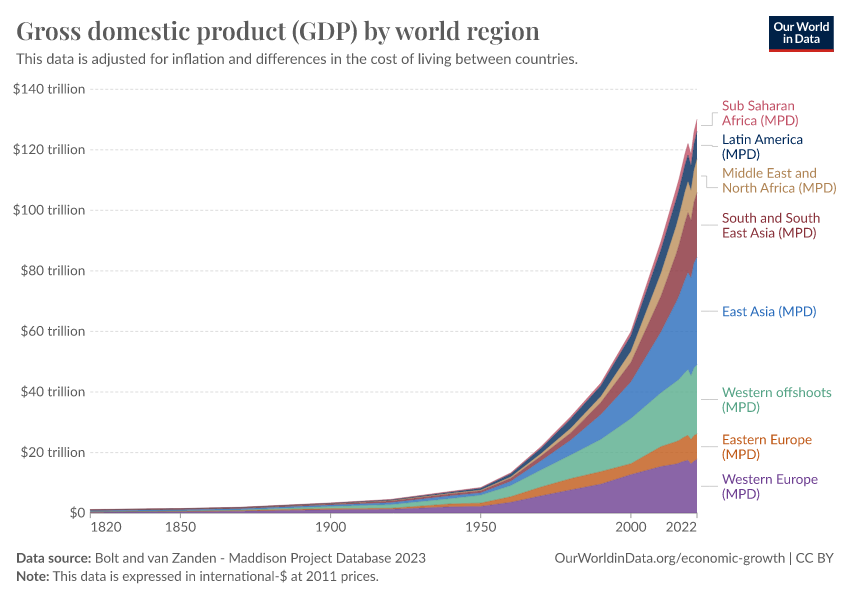
Asia is back to 44% of world GDP, from 28% in 1990
MacroeconomyNot function-specificGreater China
Data
South Korea's dependency ratio will more than double by 2050
MacroeconomyTalent & workforceJapan & Korea
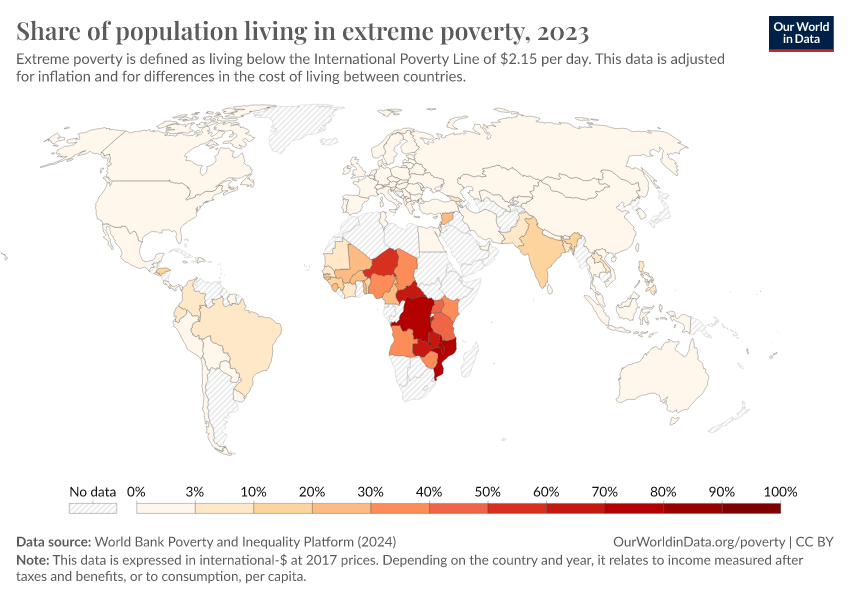
Indonesia cut extreme poverty from 86% to 4%, nearly matching China
MacroeconomyNot function-specificGreater China
Data
What does the data say about europe is older, but Latin America is aging?
Our World in DataView originalLatin America has aged eight years in two decades
MacroeconomyTalent & workforceLatin America & Caribbean