The most productive countries work the fewest hours
Original title: Annual working hours vs. productivity · Our World in Data · Date unavailable
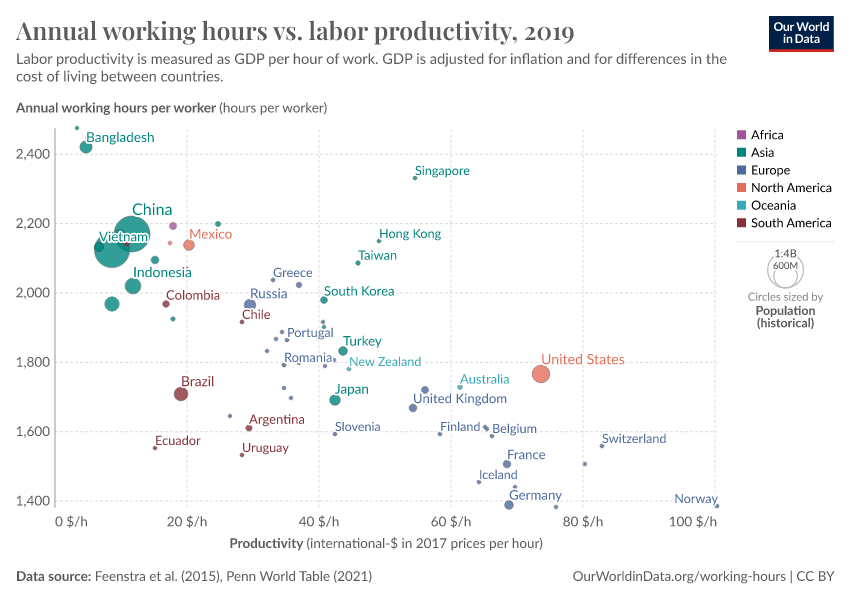
Chart: Our World in Data, CC BY 4.0
So what
A Norwegian hour produces $130 of GDP against $8 in India, yet Indians work about 1,000 more hours a year. Across 128 countries, productivity, not effort, separates rich from poor. Germany pairs the shortest year (1,335 hours) with $83 an hour, the same output per hour as the US with 450 fewer hours.
| Label | Value | Unit | Period |
|---|---|---|---|
| Norway annual hours per worker | 1412.06 | hours | 2023 |
| Norway GDP per hour worked | 130.13191 | international-$ (2021 prices) per hour | 2023 |
| Switzerland annual hours per worker | 1528.94 | hours | 2023 |
| Switzerland GDP per hour worked | 99.93163 | international-$ (2021 prices) per hour | 2023 |
| Denmark annual hours per worker | 1379.94 | hours | 2023 |
| Denmark GDP per hour worked | 88.71552 | international-$ (2021 prices) per hour | 2023 |
| Luxembourg annual hours per worker | 1452.08 | hours | 2023 |
| Luxembourg GDP per hour worked | 84.75741 | international-$ (2021 prices) per hour | 2023 |
| Netherlands annual hours per worker | 1438.74 | hours | 2023 |
| Netherlands GDP per hour worked | 84.80053 | international-$ (2021 prices) per hour | 2023 |
| Belgium annual hours per worker | 1593.29 | hours | 2023 |
| Belgium GDP per hour worked | 84.40303 | international-$ (2021 prices) per hour | 2023 |
| United States annual hours per worker | 1788.88 | hours | 2023 |
| United States GDP per hour worked | 83.531105 | international-$ (2021 prices) per hour | 2023 |
| Germany annual hours per worker | 1335.27 | hours | 2023 |
| Germany GDP per hour worked | 82.501175 | international-$ (2021 prices) per hour | 2023 |
| France annual hours per worker | 1487.1 | hours | 2023 |
| France GDP per hour worked | 77.668205 | international-$ (2021 prices) per hour | 2023 |
| United Kingdom annual hours per worker | 1522.8 | hours | 2023 |
| United Kingdom GDP per hour worked | 68.0298 | international-$ (2021 prices) per hour | 2023 |
| Italy annual hours per worker | 1701.42 | hours | 2023 |
| Italy GDP per hour worked | 67.24595 | international-$ (2021 prices) per hour | 2023 |
| Singapore annual hours per worker | 2283.18 | hours | 2023 |
| Singapore GDP per hour worked | 65.92123 | international-$ (2021 prices) per hour | 2023 |
| Spain annual hours per worker | 1637.99 | hours | 2023 |
| Spain GDP per hour worked | 63.997158 | international-$ (2021 prices) per hour | 2023 |
| Turkey annual hours per worker | 1747.46 | hours | 2023 |
| Turkey GDP per hour worked | 56.52384 | international-$ (2021 prices) per hour | 2023 |
| South Korea annual hours per worker | 1910.23 | hours | 2023 |
| South Korea GDP per hour worked | 53.608574 | international-$ (2021 prices) per hour | 2023 |
| Japan annual hours per worker | 1653.9 | hours | 2023 |
| Japan GDP per hour worked | 49.000053 | international-$ (2021 prices) per hour | 2023 |
| Poland annual hours per worker | 1806.92 | hours | 2023 |
| Poland GDP per hour worked | 46.688633 | international-$ (2021 prices) per hour | 2023 |
| Mexico annual hours per worker | 1628.87 | hours | 2023 |
| Mexico GDP per hour worked | 26.803362 | international-$ (2021 prices) per hour | 2023 |
| Brazil annual hours per worker | 1993.72 | hours | 2023 |
| Brazil GDP per hour worked | 19.95744 | international-$ (2021 prices) per hour | 2023 |
| China annual hours per worker | 2327.79 | hours | 2023 |
| China GDP per hour worked | 17.692911 | international-$ (2021 prices) per hour | 2023 |
| Indonesia annual hours per worker | 1958.47 | hours | 2023 |
| Indonesia GDP per hour worked | 14.346768 | international-$ (2021 prices) per hour | 2023 |
| Myanmar annual hours per worker | 2197.01 | hours | 2023 |
| Myanmar GDP per hour worked | 8.743789 | international-$ (2021 prices) per hour | 2023 |
| India annual hours per worker | 2382.58 | hours | 2023 |
| India GDP per hour worked | 8.060808 | international-$ (2021 prices) per hour | 2023 |
| Bangladesh annual hours per worker | 2383.18 | hours | 2023 |
| Bangladesh GDP per hour worked | 7.7235928 | international-$ (2021 prices) per hour | 2023 |
| Cambodia annual hours per worker | 2388.86 | hours | 2023 |
| Cambodia GDP per hour worked | 4.6236663 | international-$ (2021 prices) per hour | 2023 |
Related perspectives

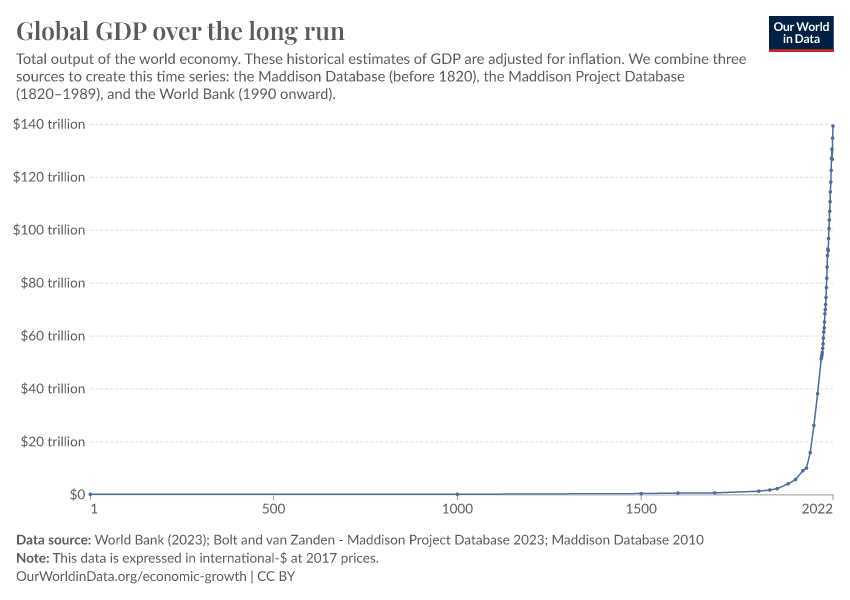
The rich-poor income gap widened from 2x in 1820 to 16x today
MacroeconomyNot function-specificNorth America
Data
South Korea's dependency ratio will more than double by 2050
MacroeconomyTalent & workforceJapan & Korea
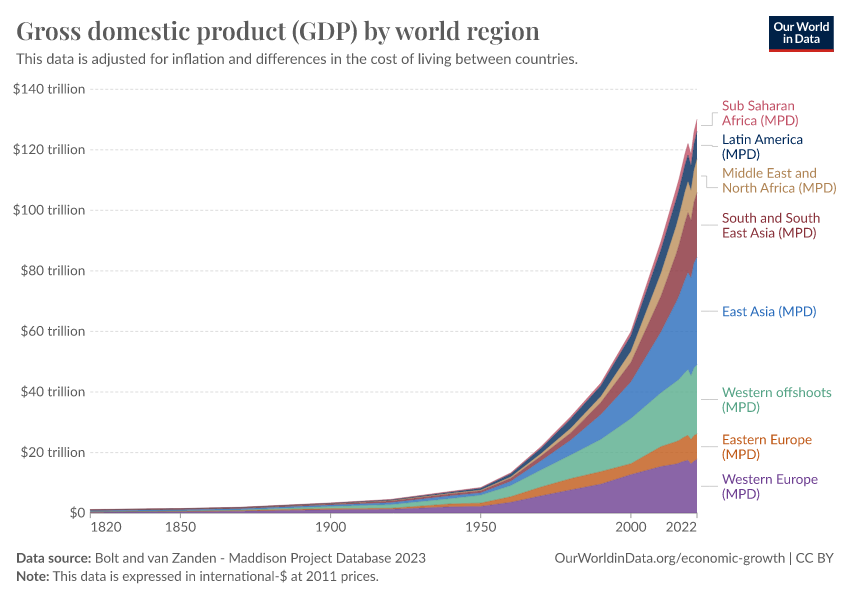
Asia is back to 44% of world GDP, from 28% in 1990
MacroeconomyNot function-specificGreater China
Data
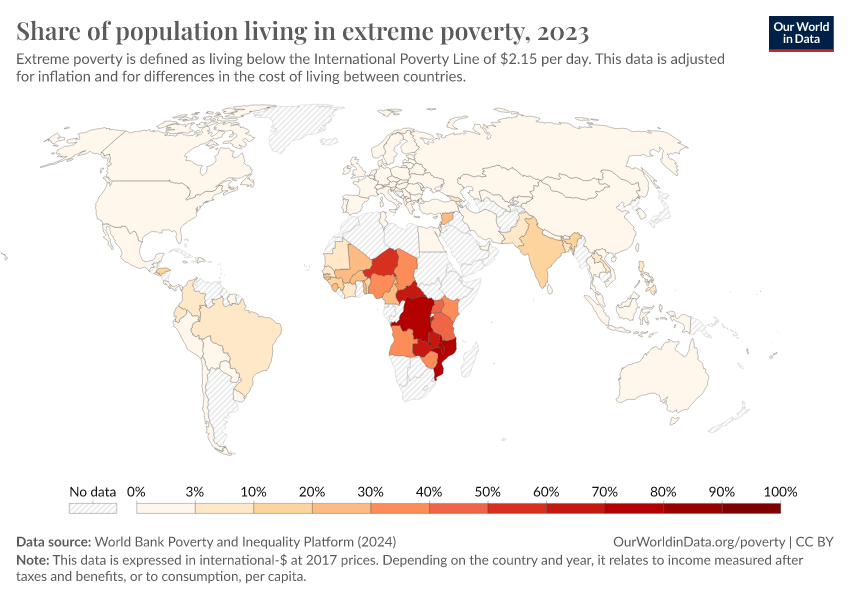
Indonesia cut extreme poverty from 86% to 4%, nearly matching China
MacroeconomyNot function-specificGreater China
Data
What does the data say about europe is older, but Latin America is aging?
Our World in DataView originalLatin America has aged eight years in two decades
MacroeconomyTalent & workforceLatin America & Caribbean