Nine African economies have more than doubled incomes since 1990
Original title: In these nine African countries, average incomes have more than doubled since 1990 · Our World in Data · 8 Sept 2026
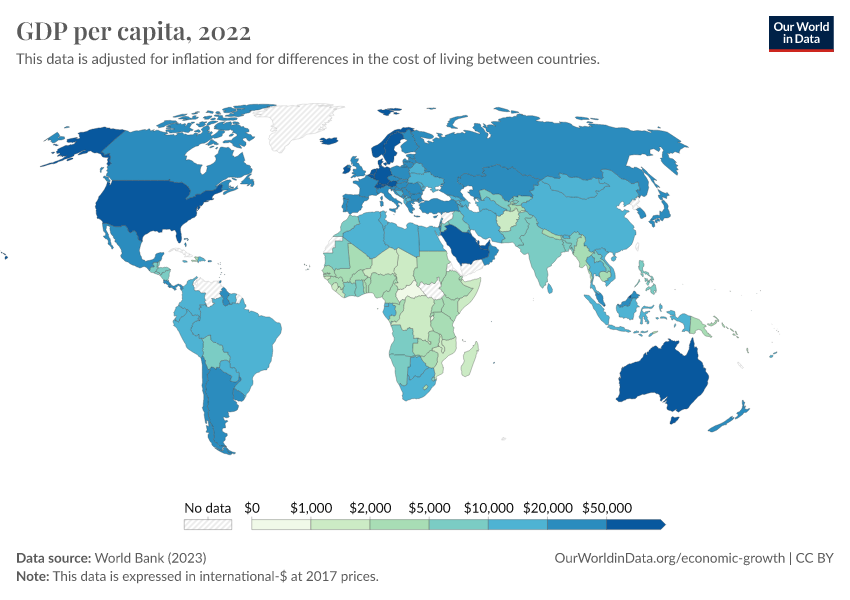
Chart: Our World in Data, CC BY 4.0
So what
From Ethiopia to Mauritius, nine African countries have grown GDP per head between 2x and nearly 6x in a generation. Ethiopia and Cape Verde led, at roughly 3.5x and 5.5x. Africa is not one growth story: the gap between these and stagnating economies such as Madagascar or Burundi is the real investment map.
| Label | Value | Unit | Period |
|---|---|---|---|
| Mauritius GDP per capita | 8986.033 | international-$ (2021 prices) | 1990 |
| Mauritius GDP per capita | 28769.514 | international-$ (2021 prices) | 2025 |
| Egypt GDP per capita | 8006.6216 | international-$ (2021 prices) | 1990 |
| Egypt GDP per capita | 17265.148 | international-$ (2021 prices) | 2025 |
| Cape Verde GDP per capita | 1848.7587 | international-$ (2021 prices) | 1990 |
| Cape Verde GDP per capita | 10395.741 | international-$ (2021 prices) | 2025 |
| Ghana GDP per capita | 2785.6711 | international-$ (2021 prices) | 1990 |
| Ghana GDP per capita | 7357.8335 | international-$ (2021 prices) | 2025 |
| Ethiopia GDP per capita | 874.3469 | international-$ (2021 prices) | 1990 |
| Ethiopia GDP per capita | 3094.8682 | international-$ (2021 prices) | 2025 |
| Rwanda GDP per capita | 1165.7261 | international-$ (2021 prices) | 1990 |
| Rwanda GDP per capita | 3558.68 | international-$ (2021 prices) | 2025 |
| Uganda GDP per capita | 1080.0383 | international-$ (2021 prices) | 1990 |
| Uganda GDP per capita | 2980.3794 | international-$ (2021 prices) | 2025 |
| Burkina Faso GDP per capita | 1107.856 | international-$ (2021 prices) | 1990 |
| Burkina Faso GDP per capita | 2624.8286 | international-$ (2021 prices) | 2025 |
| Mozambique GDP per capita | 547.6228 | international-$ (2021 prices) | 1990 |
| Mozambique GDP per capita | 1450.9596 | international-$ (2021 prices) | 2025 |
| Madagascar (decline, text) GDP per capita | 1968.2723 | international-$ (2021 prices) | 1990 |
| Madagascar (decline, text) GDP per capita | 1668.477 | international-$ (2021 prices) | 2025 |
| Zimbabwe (decline, text) GDP per capita | 6082.8687 | international-$ (2021 prices) | 1990 |
| Zimbabwe (decline, text) GDP per capita | 5529.233 | international-$ (2021 prices) | 2025 |
| Burundi (decline, text) GDP per capita | 1455.8262 | international-$ (2021 prices) | 1990 |
| Burundi (decline, text) GDP per capita | 1066.513 | international-$ (2021 prices) | 2025 |
Related perspectives

The rich-poor income gap widened from 2x in 1820 to 16x today
MacroeconomyNot function-specificNorth America
Data
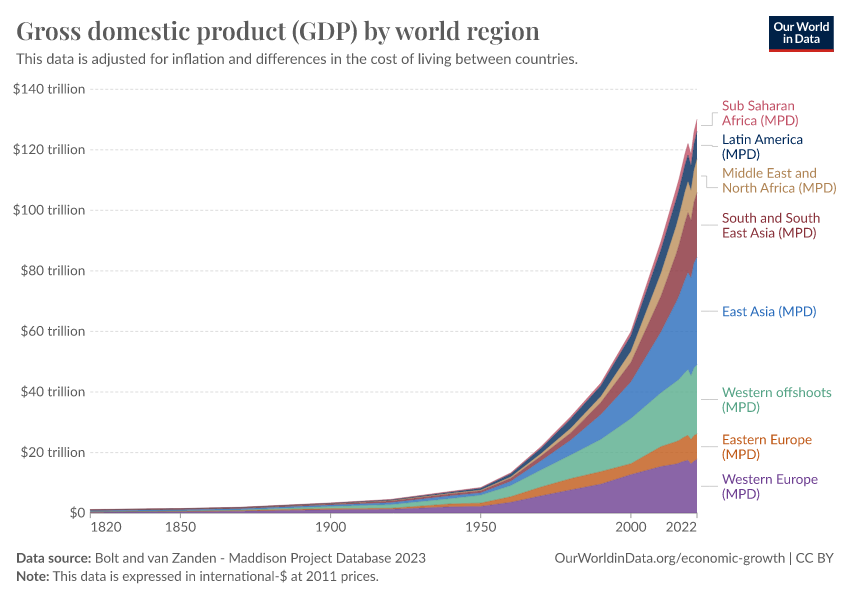
Asia is back to 44% of world GDP, from 28% in 1990
MacroeconomyNot function-specificGreater China
Data
South Korea's dependency ratio will more than double by 2050
MacroeconomyTalent & workforceJapan & Korea
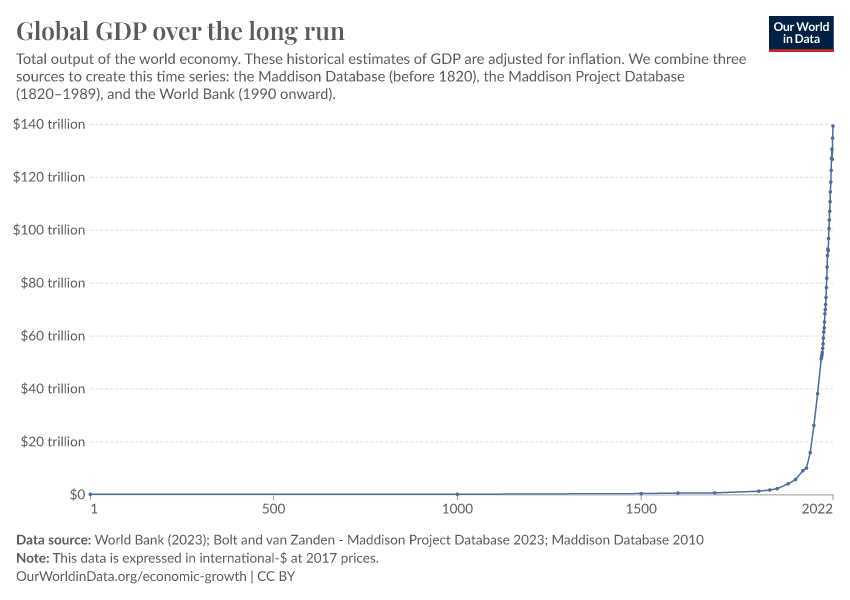
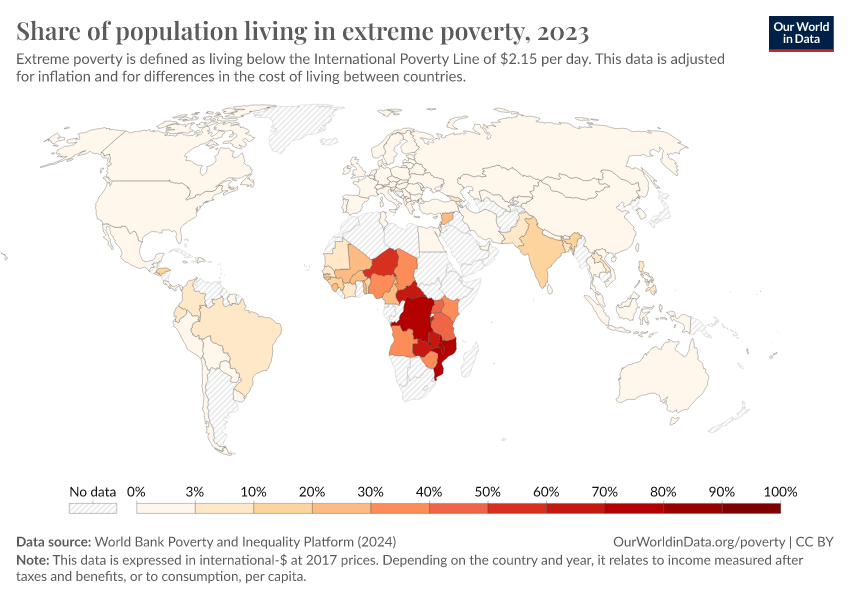
Indonesia cut extreme poverty from 86% to 4%, nearly matching China
MacroeconomyNot function-specificGreater China
Data