Solar build-out: a gigawatt a year in 2004, one a day now
Original title: In 2004, it took the world a year to add a gigawatt of solar power — now it takes a day · Our World in Data · 7 Feb 2025
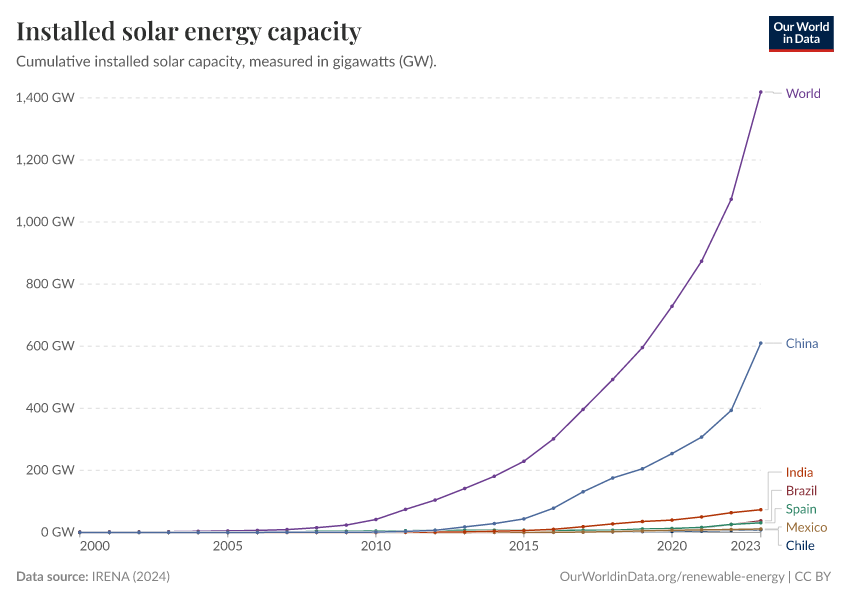
Chart: Our World in Data, CC BY 4.0
So what
Global solar capacity has grown two-thousand-fold since 2000 to about 2,400 GW, and the world now adds more than a gigawatt every day. China owns half of the installed base, which also gives it the scale advantage on the learning curve. For utilities, grid operators and equipment makers, the planning question is no longer whether solar scales but how to absorb it: storage, transmission and curtailment.
| Label | Value | Unit | Period |
|---|---|---|---|
| World installed solar capacity | 1.2213535 | GW | 2000 |
| World installed solar capacity | 3.427396 | GW | 2004 |
| World installed solar capacity | 4.9233394 | GW | 2005 |
| World installed solar capacity | 41.488235 | GW | 2010 |
| World installed solar capacity | 226.5979 | GW | 2015 |
| World installed solar capacity | 721.2222 | GW | 2020 |
| World installed solar capacity | 1057.8683 | GW | 2022 |
| World installed solar capacity | 1423.988 | GW | 2023 |
| World installed solar capacity | 1883.1776 | GW | 2024 |
| World installed solar capacity | 2396.7092 | GW | 2025 |
| China installed solar capacity | 1202.1787 | GW | 2025 |
| United States installed solar capacity | 210.8591 | GW | 2025 |
| India installed solar capacity | 135.5015 | GW | 2025 |
| Germany installed solar capacity | 107.192 | GW | 2025 |
| Time to add 1 GW of solar | about a year | — | 2004 |
| Time to add 1 GW of solar | about a day | — | 2023 |
| China share of cumulative solar capacity | 43 | % | 2023 |
| Solar panel price | 6.21 | US$/W | 2001 |
| Solar panel price | 0.31 | US$/W | 2023 |
Related perspectives
Five of the world's top 10 cities are American, led by New York
Government & public administrationCorporate strategyNorth America
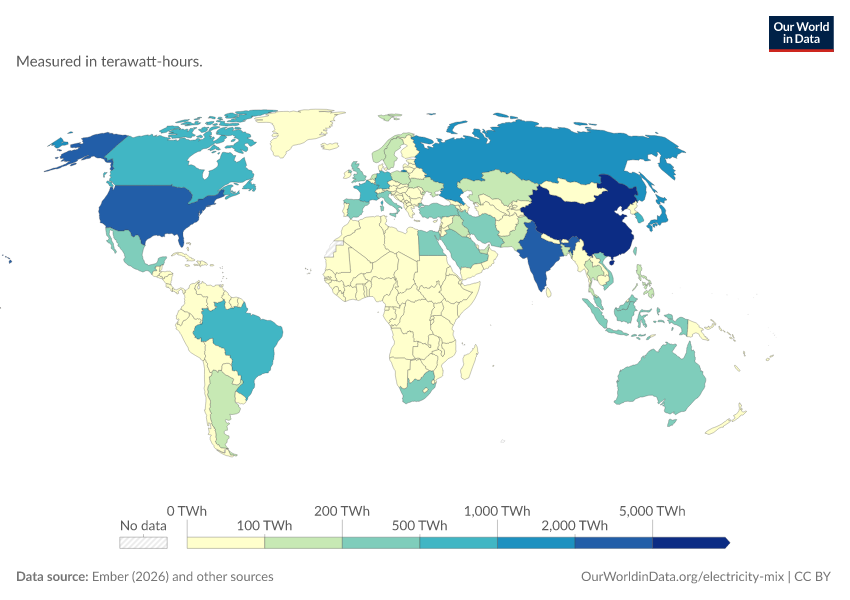
UK power generation per person down a third since 2003
Power & utilitiesCorporate strategyWestern Europe
Data
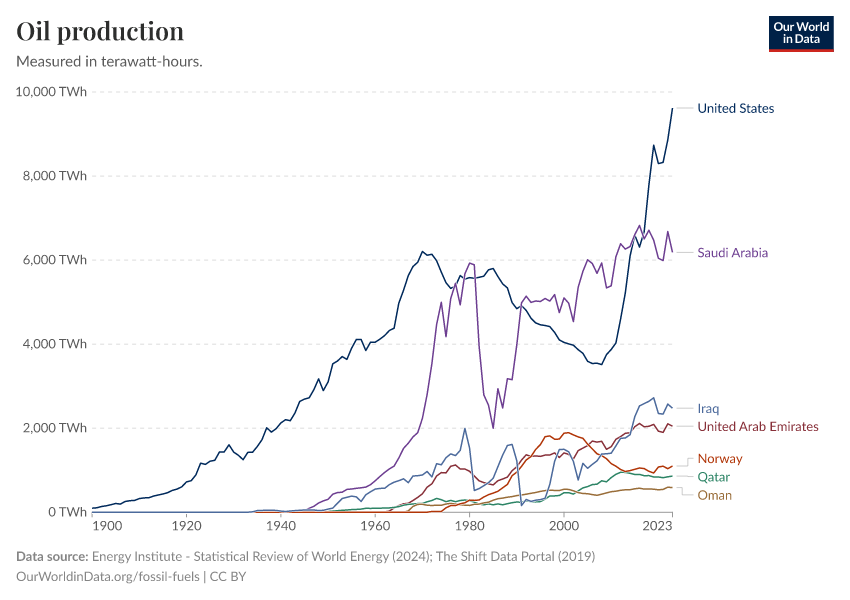
Shale made the US the top oil producer, 1.7x Saudi output
Oil & gasCorporate strategyNorth America
Data
What does the data say about around 5% of electricity in the United States?
Our World in DataView originalData centres take 5% of US power, three times the world average
Power & utilitiesIT & infrastructureNorth America
Fast-moving · data as of 12 Sept 2026

Half of Nigerians live in cities, up from one in ten
InfrastructureCorporate strategySub-Saharan Africa
Data
Asia ships 43% of the world's goods; Africa under 3%
MacroeconomyCorporate strategyGreater China